
机器学习之K-Means详解
机器学习可以分为有监督学习(supervised learning)和无监督学习(unsupervised learning)。有监督学习是训练模型从已知变量中预测未知变量,无监督学习不是去预测任何东西,而是这现有数据中找到其模式。 最主要的无监督学习模型之一是聚类。聚类算法是将相似的行数据聚合这一起,是探索未知数据的重要方法。
1. KMeans工作流
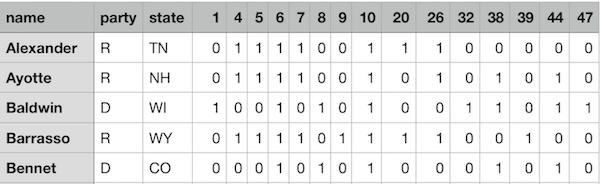
本例所用数据114_congress.csv,请右键另存。数据示意如下:
import pandas as pd
votes = pd.read_csv("114_congress.csv")
# explore the data
print(votes["party"].value_counts())
print(votes.mean())
# 计算两行的距离示例
from sklearn.metrics.pairwise import euclidean_distances
distance = euclidean_distances(votes.iloc[0,3:], votes.iloc[2,3:])
# 用k-means clustering方法
from sklearn.cluster import KMeans
kmeans_model = KMeans(n_clusters=2, random_state=1)
senator_distances = kmeans_model.fit_transform(votes.iloc[:, 3:])
labels = kmeans_model.labels_
print(pd.crosstab(labels, votes["party"])) # this will output below
‘’‘
party D I R
row_0
0 41 2 0
1 3 0 54
‘’‘
# find out the outlies
democratic_outliers = votes[(labels == 1) & (votes["party"] == "D")]
print(democratic_outliers)
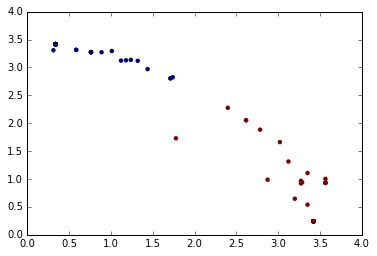
plt.scatter(x=senator_distances[:,0], y=senator_distances[:,1], c=labels, linewidths=0)
plt.show()
# 采用3次方放大距离,找出离聚类最远的值
extremism = (senator_distances ** 3).sum(axis=1)
votes["extremism"] = extremism
votes.sort_values("extremism", inplace=True, ascending=False)
print(votes.head(10))
2. K-means clustering NBA players
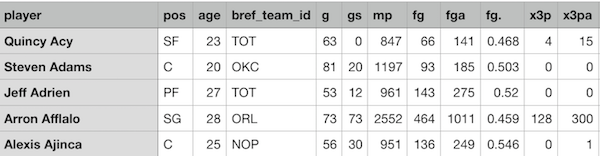
本例所用数据nba_2013.csv,请右键另存。数据示意如下(特征较多,仅显示局部几列):
聚类算法的实现:
import pandas as pd
import numpy as np
nba = pd.read_csv("nba_2013.csv")
nba.head(3)
point_guards = nba[nba['pos'] == 'PG']
point_guards['ppg'] = point_guards['pts'] / point_guards['g']
# 剔除0失误的控卫数据,0tov意味着场次太少,且0不能被除
point_guards = point_guards[point_guards['tov'] != 0]
point_guards['atr'] = point_guards['ast'] / point_guards['tov']
# nba联盟控卫场次数与助攻失误比散点图
plt.scatter(point_guards['ppg'], point_guards['atr'], c='y')
plt.title("Point Guards")
plt.xlabel('Points Per Game', fontsize=13)
plt.ylabel('Assist Turnover Ratio', fontsize=13)
plt.show()
num_clusters = 5
# Use numpy's random function to generate a list, length: num_clusters, of indices
random_initial_points = np.random.choice(point_guards.index, size=num_clusters)
# Use the random indices to create the centroids
centroids = point_guards.loc[random_initial_points]
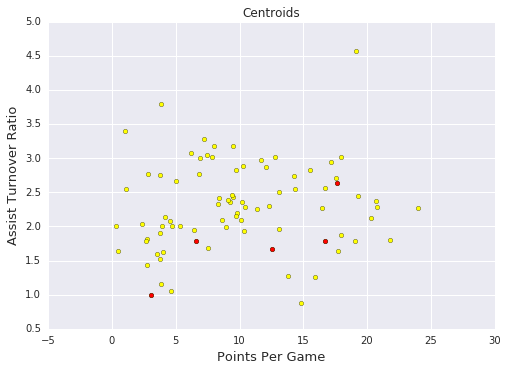
# 画出散点图,包括5个随机选取的聚类中心点
plt.scatter(point_guards['ppg'], point_guards['atr'], c='yellow')
plt.scatter(centroids['ppg'], centroids['atr'], c='red')
plt.title("Centroids")
plt.xlabel('Points Per Game', fontsize=13)
plt.ylabel('Assist Turnover Ratio', fontsize=13)
plt.show()
def centroids_to_dict(centroids):
dictionary = dict()
# iterating counter we use to generate a cluster_id
counter = 0
# iterate a pandas data frame row-wise using .iterrows()
for index, row in centroids.iterrows():
coordinates = [row['ppg'], row['atr']]
dictionary[counter] = coordinates
counter += 1
return dictionary
centroids_dict = centroids_to_dict(centroids)
import math
def calculate_distance(centroid, player_values):
root_distance = 0
for x in range(0, len(centroid)):
difference = centroid[x] - player_values[x]
squared_difference = difference**2
root_distance += squared_difference
euclid_distance = math.sqrt(root_distance)
return euclid_distance
def assign_to_cluster(row):
lowest_distance = -1
closest_cluster = -1
for cluster_id, centroid in centroids_dict.items():
df_row = [row['ppg'], row['atr']]
euclidean_distance = calculate_distance(centroid, df_row)
if lowest_distance == -1:
lowest_distance = euclidean_distance
closest_cluster = cluster_id
elif euclidean_distance < lowest_distance:
lowest_distance = euclidean_distance
closest_cluster = cluster_id
return closest_cluster
point_guards['cluster'] = point_guards.apply(lambda row: assign_to_cluster(row), axis=1)
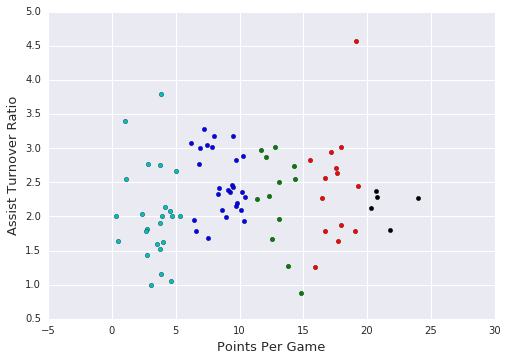
def visualize_clusters(df, num_clusters):
colors = ['b', 'g', 'r', 'c', 'm', 'y', 'k']
for n in range(num_clusters):
clustered_df = df[df['cluster'] == n]
plt.scatter(clustered_df['ppg'], clustered_df['atr'], c=colors[n-1])
plt.xlabel('Points Per Game', fontsize=13)
plt.ylabel('Assist Turnover Ratio', fontsize=13)
plt.show()
visualize_clusters(point_guards, 5)
def recalculate_centroids(df):
new_centroids_dict = dict()
for cluster_id in range(0, num_clusters):
values_in_cluster = df[df['cluster'] == cluster_id]
# Calculate new centroid using mean of values in the cluster
new_centroid = [np.average(values_in_cluster['ppg']), np.average(values_in_cluster['atr'])]
new_centroids_dict[cluster_id] = new_centroid
return new_centroids_dict
# 多次迭代。。。
centroids_dict = recalculate_centroids(point_guards)
point_guards['cluster'] = point_guards.apply(lambda row: assign_to_cluster(row), axis=1)
visualize_clusters(point_guards, num_clusters)
以上介绍了根据聚类的思想编写代码的过程,可以看出聚类算法迭代过程中聚类变化较小,总能获得稳定收敛的解,同时因为迭代收敛较慢,初始中心点的选取影响较大。sklearn提供了k-means方法,能够多次采用不同的随机初始中心点,反复迭代求得收敛结果。补充的代码如下:
sklearn.cluster.KMeans方法:
from sklearn.cluster import KMeans

kmeans = KMeans(n_clusters=num_clusters)
kmeans.fit(point_guards[['ppg', 'atr']])
point_guards['cluster'] = kmeans.labels_

visualize_clusters(point_guards, num_clusters)
Written on June 28, 2018